Driveway – 2022
Greenfield Project: My Driveway Dashboard
Dashboard is the flagship project for My Driveway for 2022, providing returning users with dynamic, transaction-oriented recommendations.
Overview
My Driveway is the account center vertical within Driveway that supports holistic vehicle management for shoppers and owners; the new Dashboard page within My Driveway provides shoppers and owners with personalized information and targeted recommendations.
-
For new and returning Driveway customers who land on My Driveway, the new Dashboard page will provide context, guidance, and personalization for a more seamless user experience that will drive engagement and transactions over a customer's lifetime with Driveway.
-
My Role as Lead Product Designer for this project included all project planning, sequencing, cross-functional coordination, and guidance/feedback for the individual contributor product and content designers. Additionally, due to resource constraints, I personally supported a large portion of the UI evolution.
-
Project Planning & Discovery
In the first quarter of 2022, business stakeholders decided our team would work on a consequential new initiative integrating existing Lithia customers into the Driveway ecosystem (Lithia is the parent company of Driveway).
We got to work brainstorming a landing page for those new users which would introduce them to the value of Driveway. Furthermore, we took the opportunity to explore a hypothesis we’d had for some time—that a landing page would serve as a dynamic homepage for returning users that would help drive transactions.
To support project planning and discovery, I created a design project overview & planning document to cover scope, activities, and more. I also sequenced all the requisite tasks for the designers in our project management software, Favro.
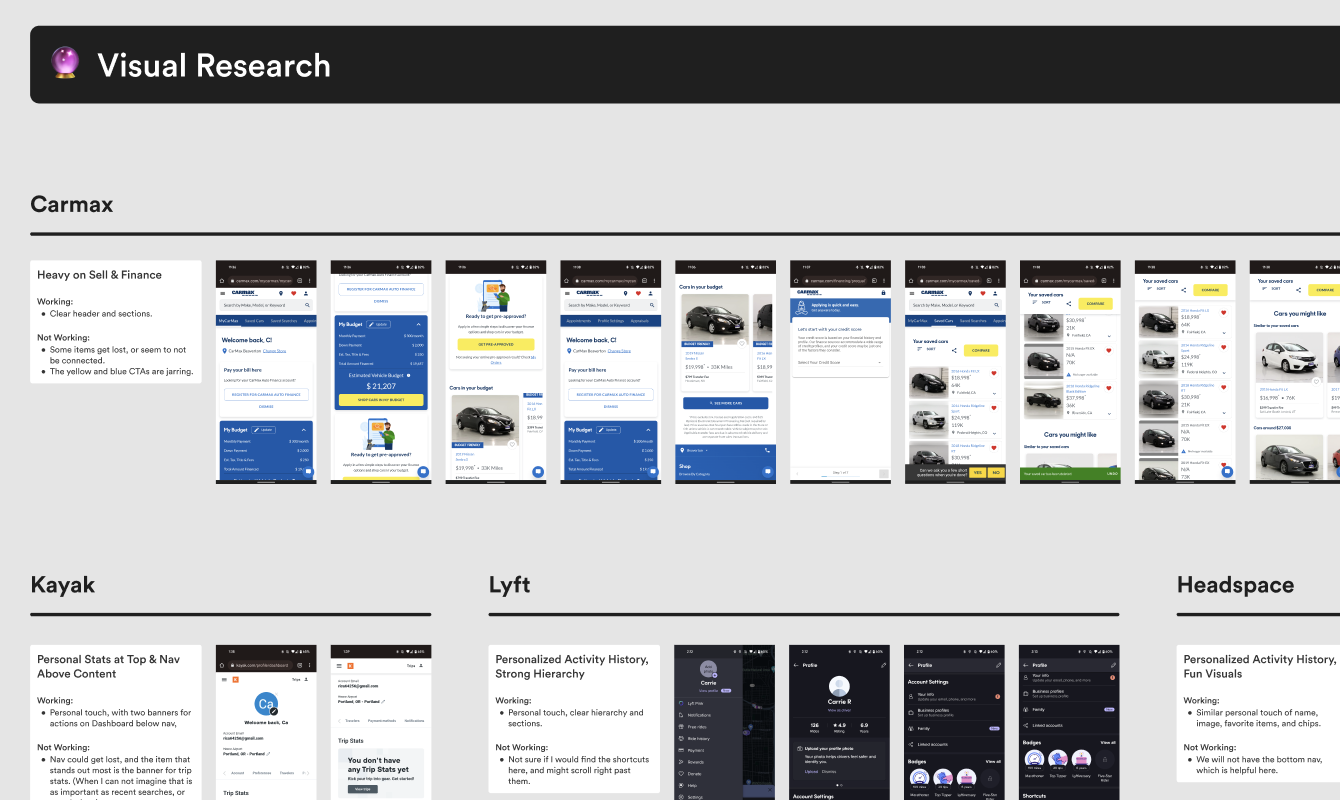
For discovery, I created tasks for the designers to do visual research and user flows to help our understanding of project possibilities and the end user perspective.
Design Evolution & Stakeholder Approval
The evolution of the project was split between two distinct phases: concepting and designing.
We started with concepting at a low-fidelity to determine what the narrative would be that would guide the design at a high level. After swarming on different concept approaches, exploring many styling directions (See concepting round 1 and round 2), pressure testing different dashboard states, and getting team feedback (See concepting team review), we aligned on a final concept, called Customer Retention, which we translated to a demo for stakeholder approval.
Following stakeholder buy-in, we transitioned to designing at higher fidelity (see design round 1, team review, and round 2). At this stage of the project we had some resourcing challenges so I contributed the majority of the UI explorations that lead to the final designs. The project culminated in a demo where we received stakeholder approval to transition to engineering development (See production handoff).
Throughout the design evolution, the Content Designer on the team worked closely with the Product Designers to evolve the copy along with the various design iterations.
Implementation & Measuring Impact
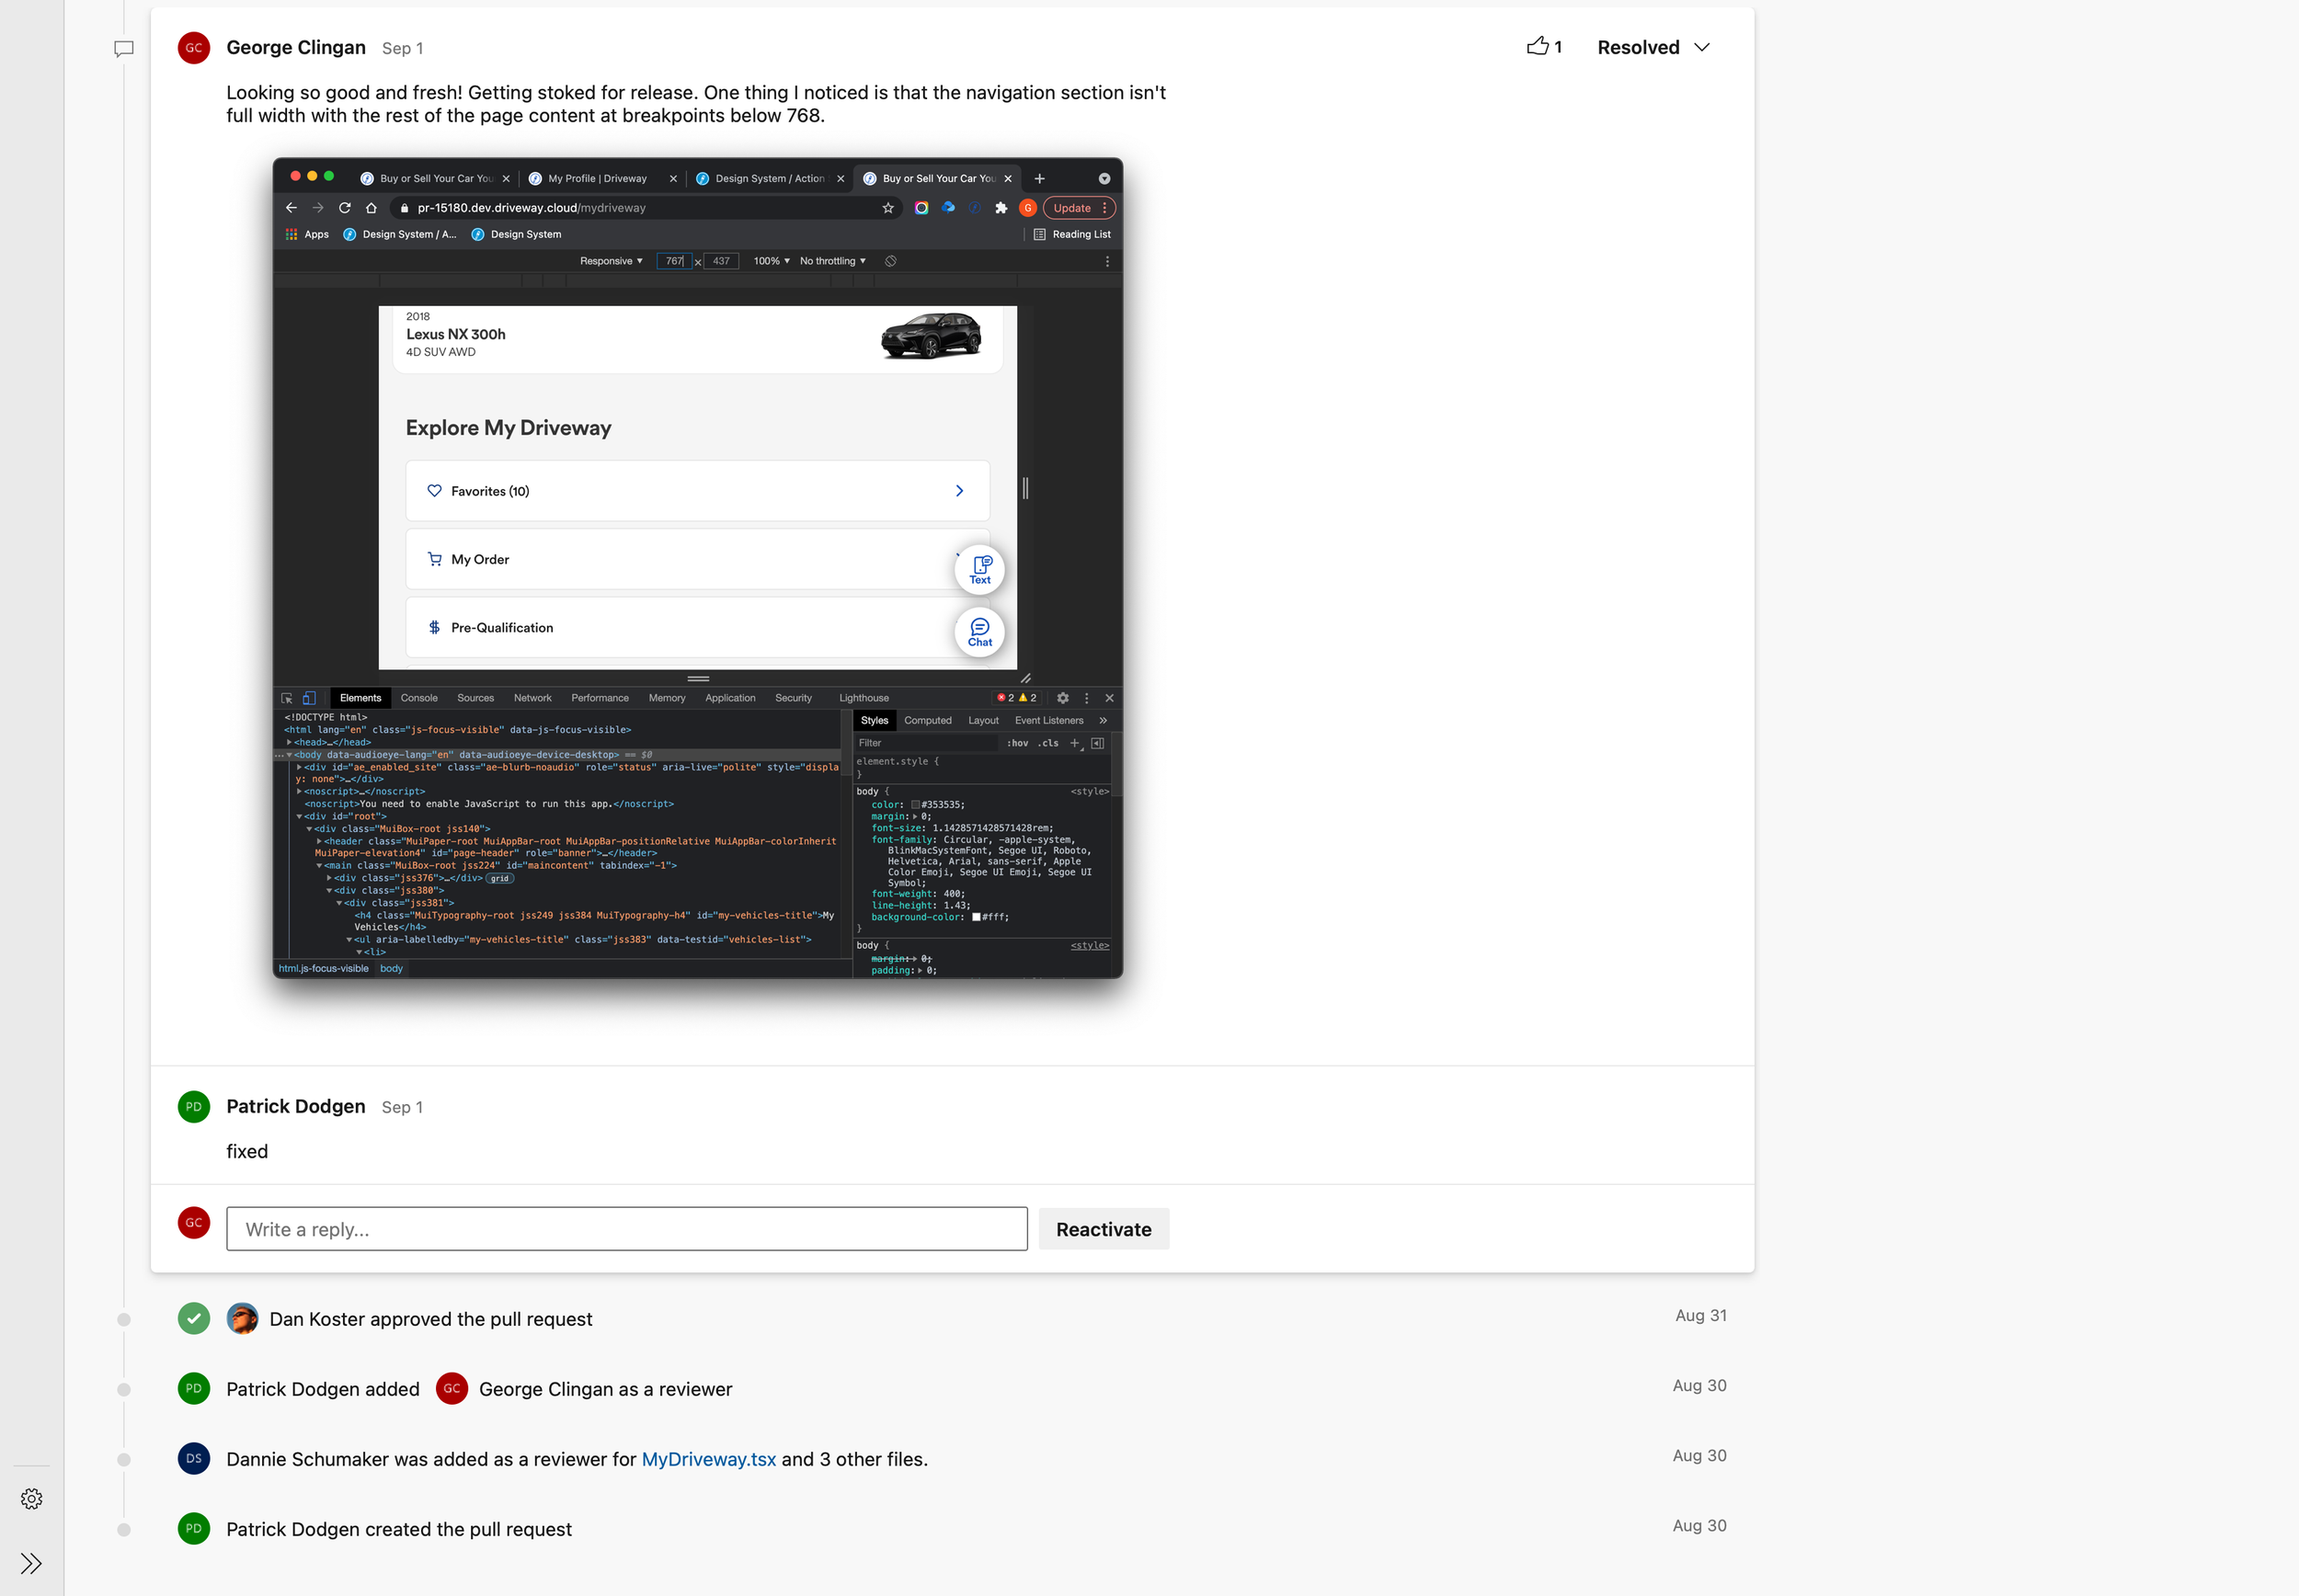
At Driveway, the Experience Design team has a project phase dedicated to VQA (Visual QA) whereby designers review the PRs (Pull Requests) of the engineers before they merge their work to the appropriate development environment. While we make an effort to annotate production-ready designs as best we can, discrepancies are inevitable. For dashboard, I spent many hours reviewing PRs, inspecting the code, and providing feedback for the engineers.
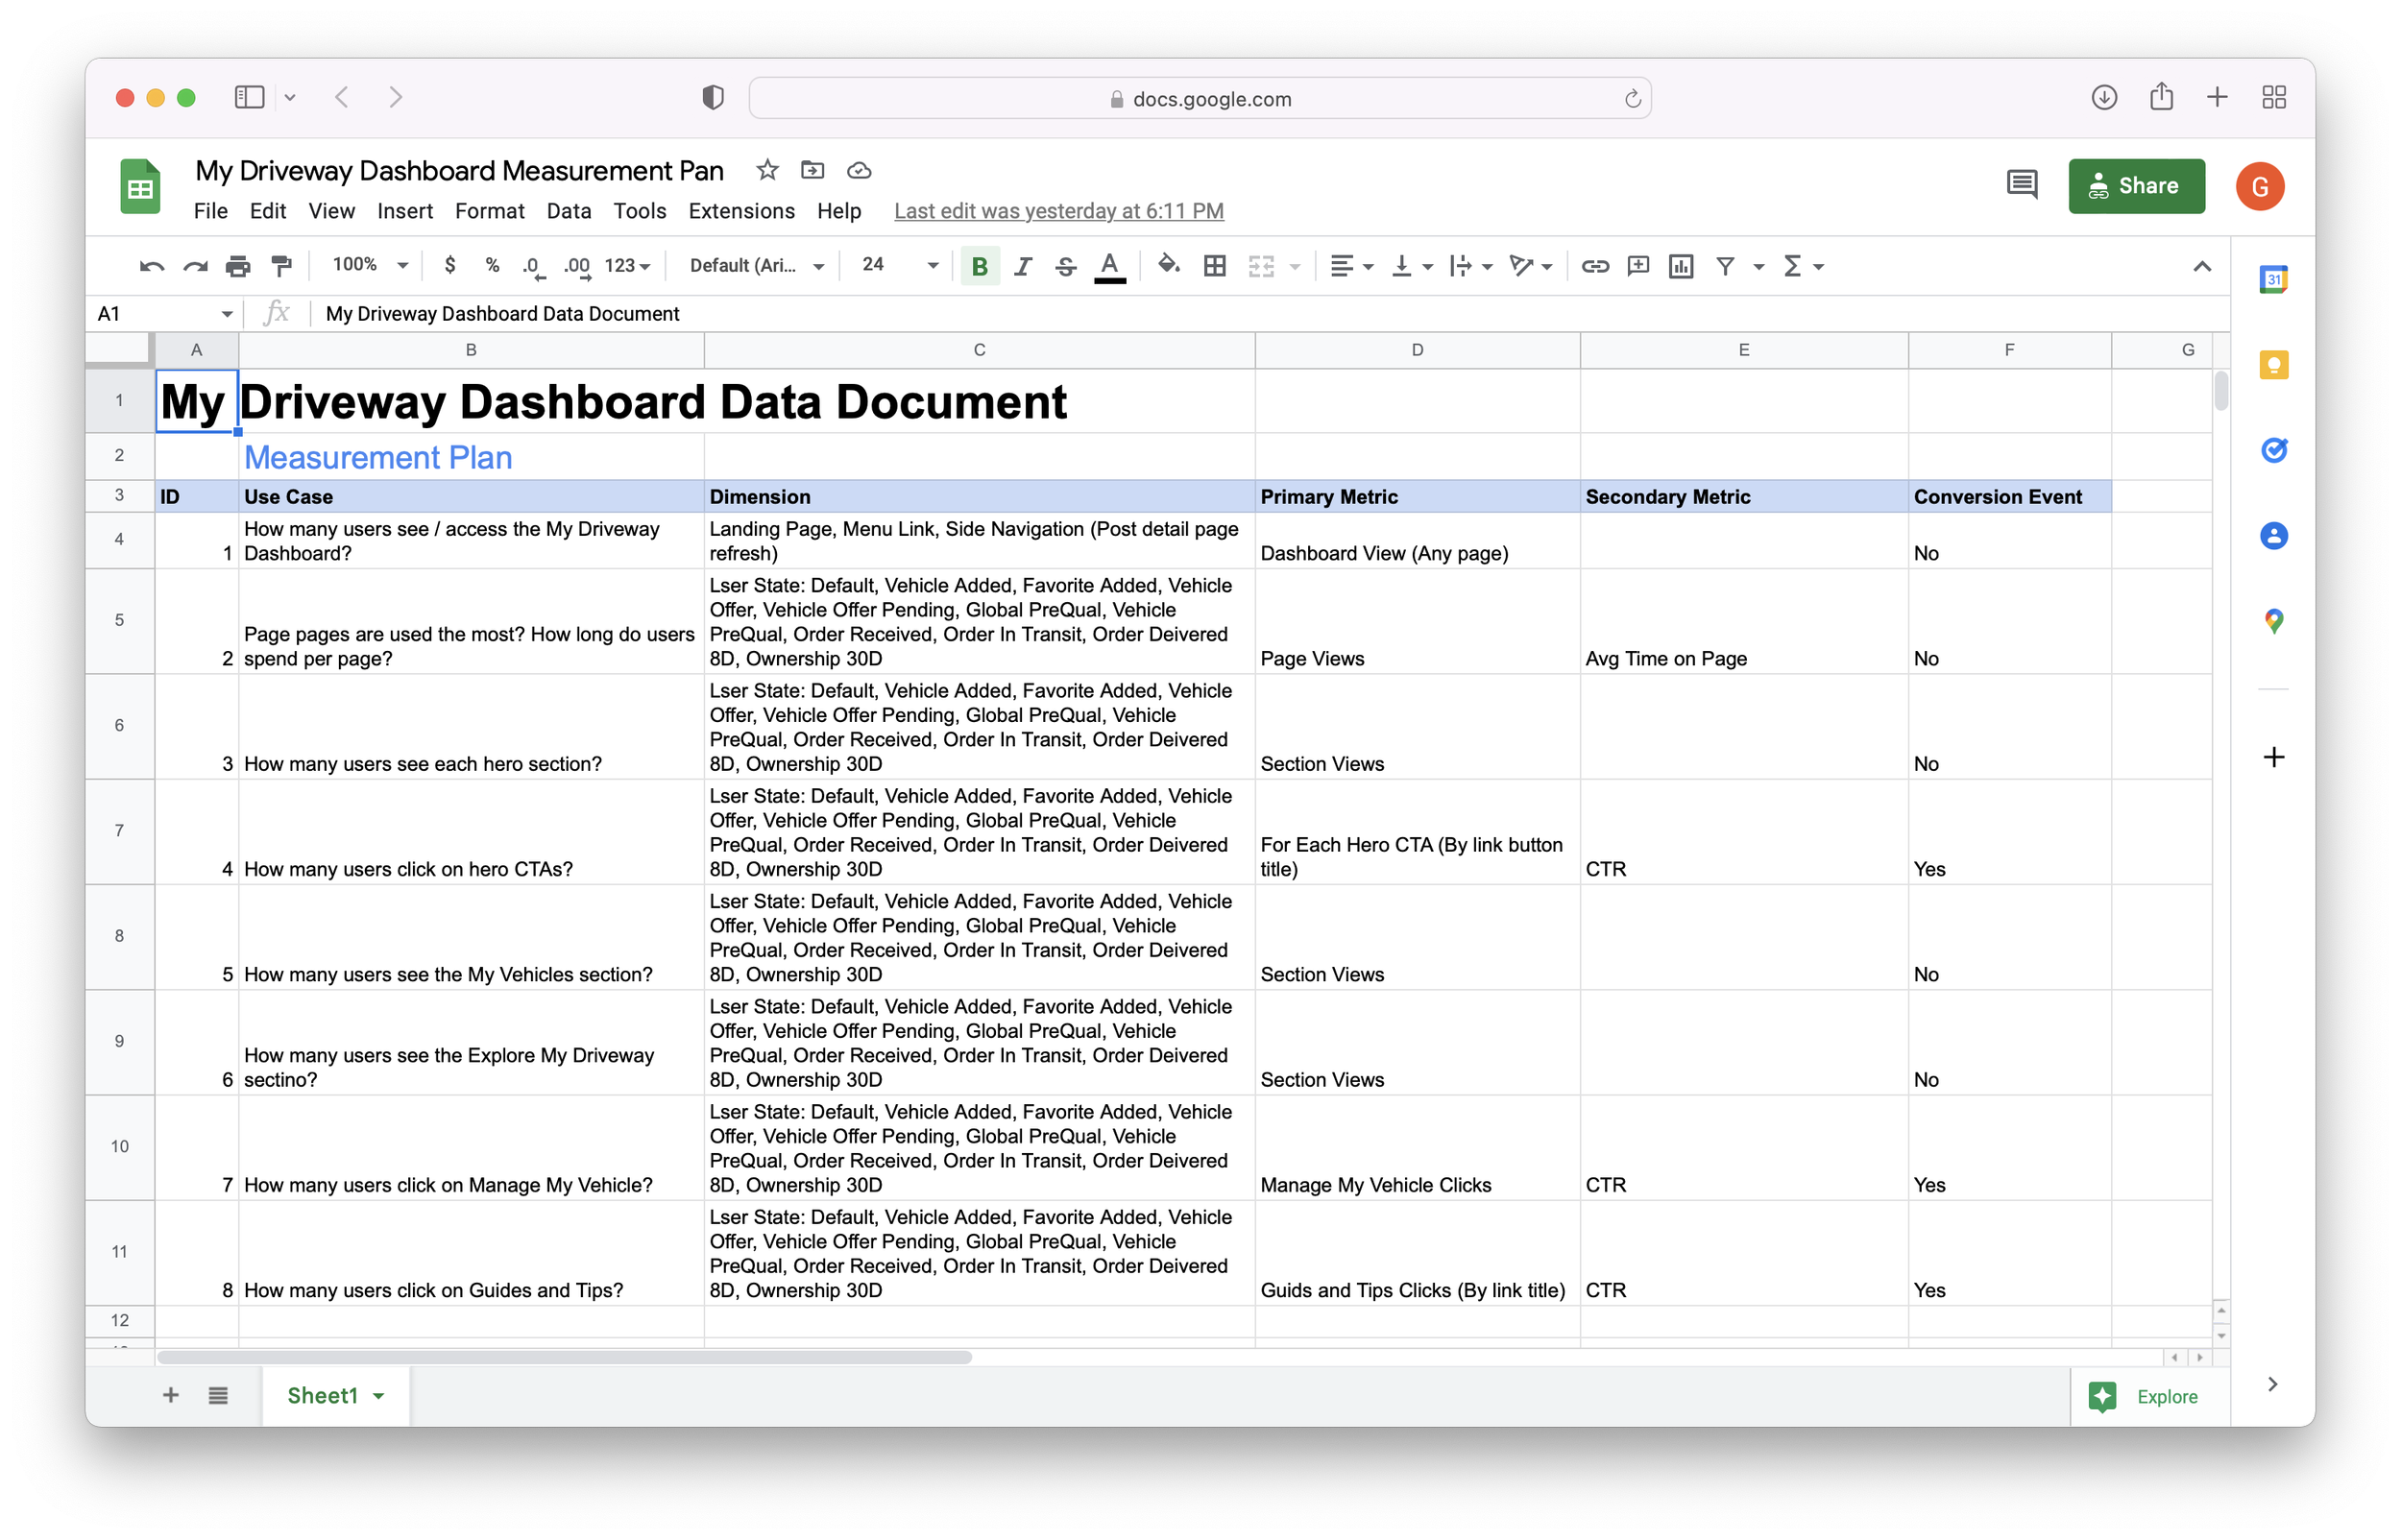
In terms of measurement, I worked with my product counterpart to create measurement documentation to define what metrics we wanted to measure and coordinate with our data analytics team to ensure they understood what we wanted to learn.
Our primary questions were:
What percent of user sessions include the dashboard?
What page states are used the most? How long do users spend per page?
How many users see each page state?
How many users click on hero CTAs?
Project Retro and Learnings
No project winds up going exactly as it was planned, and dashboard was no exception. We learned halfway through the project that stakeholders no longer desired to include Lithia Customer Onboarding or Navigation Redesign as part of the effort. These things happen, but it was difficult for us to adapt the project to the new scope and goals because our MVP was so large (13 different page states). In the future I will be more diligent in advocating for lighter-weight MVPs to more quickly validate our initial hypothesis.
Additionally, due to scope changes, our core hypothesis became much harder to test. Instead of introducing Lithia customers to the dashboard when they onboarded with Driveway, now our only users would be existing driveway users who would have to choose to navigate to the landing page when they returned. Without a built in user-base to be introduced to the page, we will need to coordinate with other teams post-launch to advertise the value of dashboard within their user flows (e.g. Sell Flow, Cart, Pre-Qualification, etc.). Or redirect returning users from the homepage to the dashboard.
However we solve this data measurement issue, design will need to continue to work closely with product and engineering to learn the true impact of the dashboard to understand if it’s worth building out further for our users.


